





Pokémon card index
Every Pokémon set we track, and what it did over the last year.
Thursday 8 October. 1 of the 1 sets we track are worth more than a year ago. These are ungraded prices, the card as it sits in your binder, and each line below is the price in the middle of that set: half its cards sell for more, half for less.
Why old sets and not new ones. A set printed twenty years ago cannot be printed again, and most of it was thrown away. A set from last year is still being opened by the crate. That is the whole story on this page, and you can watch it happen in the lines below.
Is your card up, or down?
The market is one thing, your card is another. Type a name to see which one you have.
 Lillie #397/SM-P$3.4k▲ 113612%
 Sceptile #3$220▼ 96%
 Gengar Prerelease Staff #SWSH241$2.2k▲ 6249%
 Charizard VMAX #104/S-P$80▼ 96%
 Pikachu CoroCoro Non-Glossy #25$600▲ 5355%
 Primal Kyogre EX 1st Edition #73$130▼ 78%
 Hitmonlee 1999-2000 #22$131▲ 4264%
 Cosmog Club Promo #99$80▼ 77%
 My First Battle Pikachu & Bulbasaur$87▲ 2313%
 Rosa's Encouragement #115$60▼ 75%
 Gengar 1999-2000 #20$365▲ 2301%
 Rosa's Encouragement #115$60▼ 75%
 Hypno 1999-2000 #23$99▲ 1789%
 Mega Latias ex #181$70▼ 73%
 Moltres 1999-2000 #27$173▲ 1625%
 Oricorio Ex #111$29▼ 73%
Sets that went up
What a middling card in each set cost in September 2025, and what it costs today. Ungraded, the card as it sits in a sleeve. Every set here has at least 15 cards we priced in every one of those 14 months, so a number moved because prices moved and not because we added cards.
| Set | September 2025 | Now | Change |
|---|---|---|---|
| Legendary Collection21 cards tracked | $142 | $310 | +119% |
Sets that went down
Almost all of these are recent sets. A set still in print keeps arriving, and a card that keeps arriving gets cheaper.
| Set | September 2025 | Now | Change |
|---|
Cards that moved, and what got pulled
The last column is one nobody else can print. Every other card index reads sale prices. We also record every pack opening the rip sites publish, so this says how often each card was actually handed out in the last seven days.
| Card | 1 year | Pulled, 7d | |
|---|---|---|---|
| Moltres [1999-2000] #27Fossil | +1625% | $2.2k | 650 |
| Articuno [1999-2000] #17Fossil | +1429% | $522 | 114 |
| Ditto [1st Edition] #64Japanese Split Earth | +1397% | $1.2k | 380 |
| Ditto [1st Edition] #64Japanese Clash at the Summit | +1286% | $1.4k | — |
| Weakness Guard #141Aquapolis | +961% | $448 | 1 |
| Pikachu [Holo] #10Japanese 2002 McDonald's | +887% | $4.3k | 2,636 |
| Deoxys [Reverse Holo] #2Call of Legends | +856% | $2.3k | 9 |
| Cubone [Reverse Holo] #60Delta Species | +833% | $1.8k | 96 |
| Raichu #58/ADV-PJapanese Promo | +821% | $694 | 273 |
| Shuckle [Reverse Holo] #96Skyridge | +710% | $390 | — |
| Pikachu [1st Edition] #22Japanese Miracle of the Desert | +655% | $298 | — |
| Dragonite #18Triumphant | +651% | $4.5k | 82 |
| Card | 1 year | Pulled, 7d | |
|---|---|---|---|
| Ethan's Slugma #23Ascended Heroes | -97% | $123 | — |
| Larry's Komala #175Ascended Heroes | -96% | $133 | 67 |
| Tyrunt #70Promo | -96% | $153 | 6,646 |
| Noctowl [Prize Pack] #115Stellar Crown | -95% | $150 | 324 |
| Pupitar [Cosmos Holo] #111Paldea Evolved | -92% | $107 | 74 |
| Whimsicott #19Promo | -90% | $111 | 56 |
| Galarian Obstagoon #245Ascended Heroes | -90% | $56 | 7,951 |
| Psychic Energy #95Evolutions | -90% | $193 | — |
| Weavile #21Promo | -89% | $140 | 1,108 |
| Hop's Dubwool #136Journey Together | -88% | $114 | 442 |
| Marshadow #146Mega Evolution | -88% | $91 | 8,668 |
| Team Rocket's Meowth #161Ascended Heroes | -88% | $52 | 1 |
Added this week
New card pages this week
Twelve cards a day get a full page: live raw, PSA 9 and PSA 10 prices, the price history, and every real pull of that card we have recorded across the pack sites.
 Magnemite #SV27Hidden FatesRaw $3·PSA 10 $46
 Shining Mew #40Shining LegendsRaw $146·PSA 10 $1.4k
 Ampharos #1Neo RevelationRaw $28·PSA 10 $1000
 Zorua #75Shrouded FableRaw $24·PSA 10 $114
 Starmie #5Japanese Melee Pokemon ScrambleRaw $116·PSA 10 $292
 Pikachu #60JungleRaw $4·PSA 10 $560
 Friends in Sinnoh #149Crown ZenithRaw $8·PSA 10 $86
 Gyarados EX #123BREAKpointRaw $131·PSA 10 $4.2k
 Magmar [No Rarity] #126Japanese Expansion PackRaw $27·PSA 10 $1.5k
 Shining Genesect #9Shining LegendsRaw $14·PSA 10 $159
 Golisopod GX #SV48Hidden FatesRaw $11·PSA 10 $94
 Dark Slowbro #12Team RocketRaw $42·PSA 10 $1.4k
 Kangaskhan #204Destined RivalsRaw $11·PSA 10 $165
 Raichu #211Paldea EvolvedRaw $96·PSA 10 $866
 Arbok #176Temporal ForcesRaw $25·PSA 10 $156
 Scyther #10JungleRaw $23·PSA 10 $1.6k
 Charizard V #18Crown ZenithRaw $8·PSA 10 $133
 Electabuzz EX #97Ruby & SapphireRaw $47·PSA 10 $1.8k
 Spiritomb #76Japanese Dark PhantasmaRaw $4·PSA 10 $43
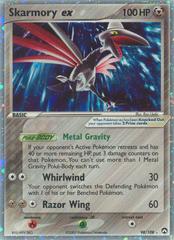 Skarmory EX #98Power KeepersRaw $44·PSA 10 $1.8k
 Vaporeon #TG02Brilliant StarsRaw $22·PSA 10 $328
 Latias #GG20Crown ZenithRaw $18·PSA 10 $317
 Tyranitar #16Delta SpeciesRaw $70·PSA 10 $1.9k
 Aggron EX #153Primal ClashRaw $28·PSA 10 $1.9k
Questions
Is the Pokémon card market crashing?
Not on this data. The basket of 206 cards is up 445% over 14 months, and the rise is broad rather than narrow: 8,107 of the 11,023 cards we price are worth more than a year ago. That is the honest answer today, and it is not a forecast. 2,721 cards did fall, so a crash is not required for your card to lose money.
Are Pokémon cards a good investment?
A 445% year looks like a good investment and also like what a bubble looks like from the inside, and nothing in this data separates the two. What the data does say plainly: the average card rose far faster than the middle card, 525% against 445%, which means the gains are concentrated at the expensive end. If you are buying $30 cards, the index above is not describing your outcome.
What is in the index?
A fixed basket: the 206 cards that had a PSA 10 price in every one of the last 14 months. Fixed matters. If you take a median across every card we hold each month instead, it reads $58 to $98, but the number of cards in that median climbs from 6,146 to 8,048 over the same window. That is our collector adding cards, not the market moving.
Why show both a median and an average?
Because they disagree, and the disagreement is the story. The median card is up 445% and the average card is up 525%. When the average pulls away from the median like that, a small number of expensive cards are doing most of the work. The chart rebases both to 100 so you can see the gap open.
Where do these prices come from?
Real completed sales, refreshed daily, not asking prices. The index is computed once a night from the price history we hold for every card, and the page reads that result rather than recomputing it.
Where these numbers come from. Real completed sales, not asking prices. Every night we take the cards that had a price in every one of the last 14 months and measure only those, so a number moves when prices move and not when we add cards. Ungraded throughout, the card as it sits in a sleeve.
Want a price for one card rather than the whole market? Check any card. Want to see what the pack sites are paying back? Every site, counted live. Want the boxes rather than the packs? Every Pokémon mystery box, with the odds.